


Reach the Montgomery County Health Department at 765-364-6440 or visit online at www.montgomerycounty.in.gov/
health.
When it comes to public health, people think about the PSAs about different diseases, the opioid crisis or inspections. While inspections and education are the visible parts of public health, which people encounter every day, there is a lot more work happening behind the scenes. Public health is similar to an iceberg, and, beneath the surface, there is a lot of effort put in monitoring and identifying vulnerable places within the health department’s jurisdiction. In fact, this is the first step in any sort of public health intervention, because impromptu, random interventions more often than not yield limited and inadequate results, while also wasting valuable resources such as taxpayer dollars that can be used to better the lives of people in our community.
Public health is also a huge field, where multiple agencies have to collaborate in order to keep your community safe and secure — from the local health department, to EMS, to the police, to the mayor’s office. Once all these services identify the issues and are on the same page with how to solve it, they can take effective action towards addressing the issues.
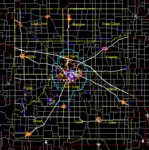
This year, the Montgomery County Health Department, with the help from other county agencies, is creating a risk map, using a Geographic Information System. The GIS is used to create layers of points on a map, each layer representing a different class of locations, and introduce data about each individual point based on a framework defined for the layer. For instance, the health department may use three different layers to plot overdose cases, homes deemed unfit for human habitation and subsidized housing, each point with its own data about the address, and represented by a different symbol.
The purpose of GIS is to centralize information from all Montgomery County agencies into a system where they can be cross-referenced easily, quickly, and effectively, to generate swift, preemptive responses to whatever issues the system may uncover in the county. For example, there might be multiple incidents on a certain street or certain area of the county, or a consistent correlation between homes deemed unfit for human habitation and addresses with multiple EMS runs the previous year. The results are then communicated to other local authorities, as deemed necessary, to intervene in those hotspots and address the issues of those communities, for the betterment of our community.
As with all data systems, GIS works better the more data is plotted. The goal is to use GIS to uncover health disparities and inequities of any kind among Montgomery County residents and to address them as soon as possible.
According to the 2018 Health Equity Report, available on the county website, there are some limitations to the health equity data collected up to the point of its publishing, related to the small sample size and limited responses of underprivileged groups. GIS can address these limitations by providing agencies with information on where and why these disparities exist, in the form of symbols on a map of the county. For public health surveillance to work, we can only work with data from the field.
There are many, many other tools that county agencies use. Yet, our efforts would be fruitless without effective communication between all departments. There are so many overlaps in public health that, more often than not, multiple agencies have to intervene. Without this inter-agency communication, the GIS system would not be able to serve its purpose. Technology is only as effective as the agencies themselves when it comes to addressing issues.


